Excel is where most businesses start. When the spreadsheets get too big, too slow or too hard to share, Power BI takes over: one trusted set of numbers that refreshes itself and that your team can explore in a browser or on their phone.
With 18+ years in finance and reporting, I build dashboards that answer the questions a management team actually asks.
Reports Dashboard Design & Build
Interactive Power BI reports for sales, finance and operations, designed around the decisions you need to make.
Migration Excel to Power BI
Turn your existing Excel reports into a Power BI model that refreshes itself, without losing the logic you trust.
Modelling Data Modelling & DAX
Clean, fast data models and measures for margins, budgets, year-on-year comparisons and rolling totals.
Data prep Power Query & Data Cleaning
Connect to Excel, CSV, SQL and accounting-system exports, then clean and combine the data automatically.
Power BI Service Publishing & Refresh
Set up workspaces, scheduled refresh and secure sharing so the right people always see up-to-date numbers.
Training Training & Handover
1:1 or team sessions so your people can use, update and extend the reports with confidence.
Demo Dashboards
Examples
Built in Power BI Desktop for Northfield Supplies Ltd, a fictional UK distributor, using sample data. Click any dashboard to see it full size.
Sales Performance
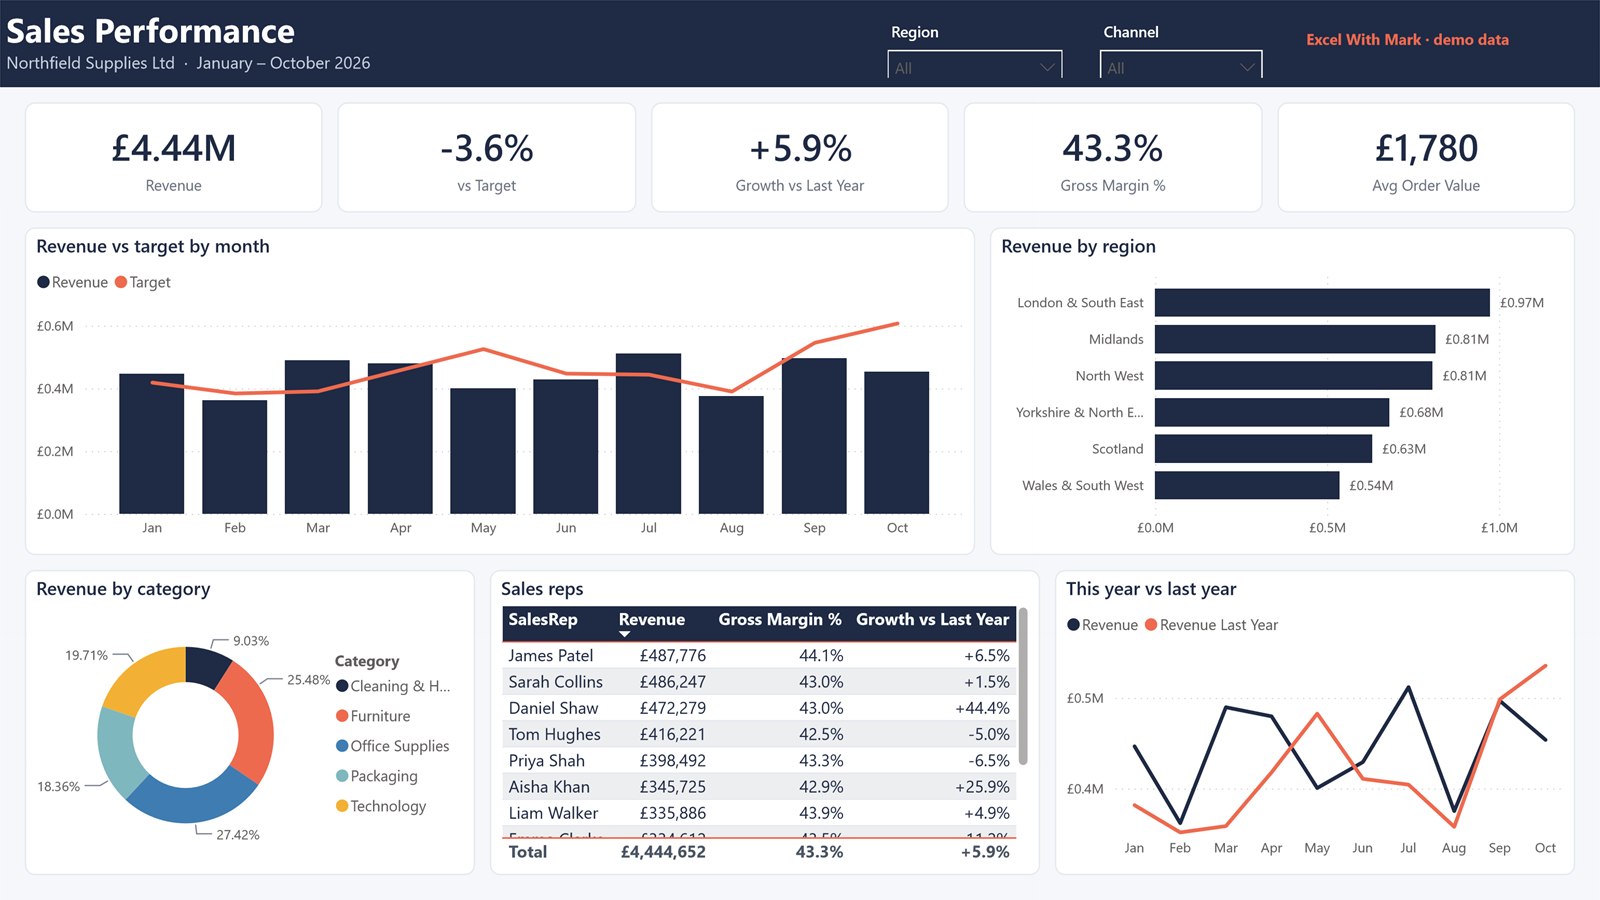
Revenue against target, growth on last year, margin by region and product category, and a sales rep league table, with slicers for region and channel.
Management Pack
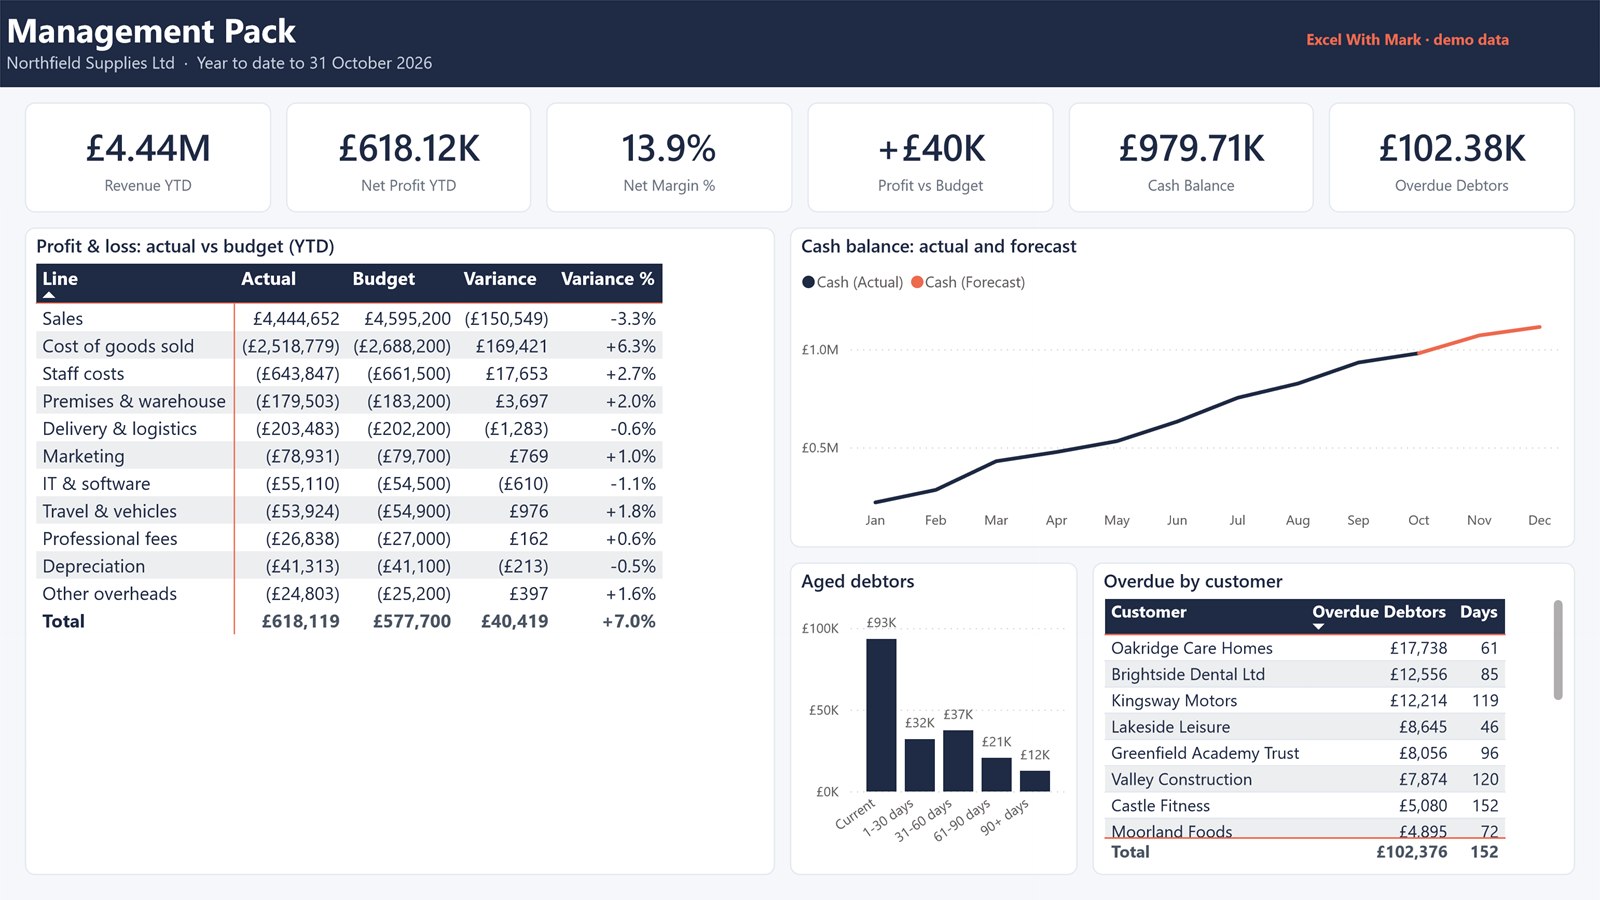
A month-end pack on one page: P&L actual vs budget, cash balance with forecast, aged debtors and the customers to chase first.
Operations KPIs
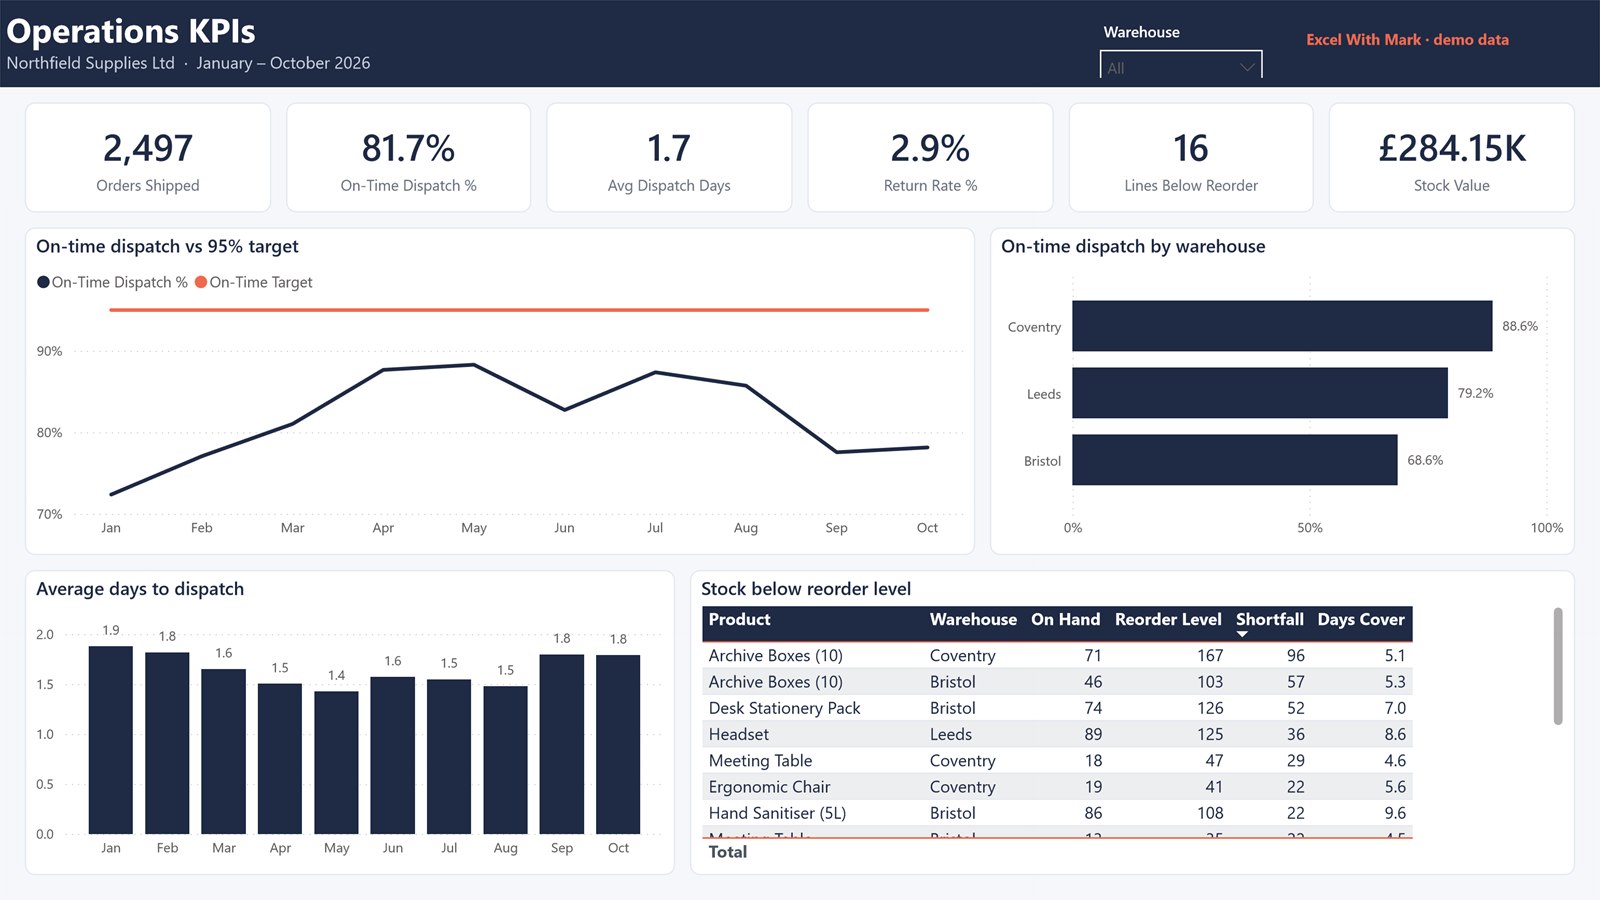
On-time dispatch against a 95% target, dispatch speed by warehouse, return rate and the stock lines that need reordering.
Let’s Talk
Get started
Not sure whether you need Power BI or simply a better Excel workbook? Book a free 15-minute call and I’ll tell you honestly which fits your business.