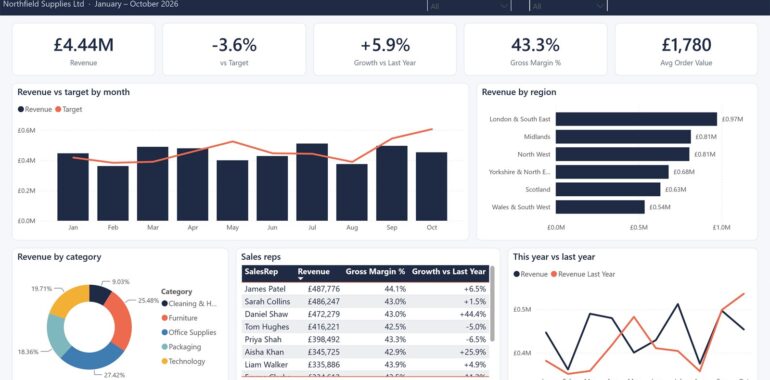
Almost every business I work with runs on Excel, and for good reason: it’s flexible, everyone has it, and you can build almost anything in it. But at some point the spreadsheets start to creak. Reports take days to pull together, numbers don’t match between files, and only one person really understands how it all works. That’s usually when someone asks: should we be using Power BI?
The honest answer is sometimes. Here’s how to tell.
When Excel is the right answer
- One person builds and uses the report. If it’s your own tracker or model, Excel is faster to build and easier to change.
- You need to type data in. Budgets, forecasts, invoices and to-do lists all need input. Power BI is for analysing data, not entering it.
- It’s a one-off or ad hoc analysis. A quick pivot table beats setting up a data model.
- You’re doing complex what-if modelling. Scenario models and detailed calculations are still Excel’s home ground.
When it’s time for Power BI
- Several people need the same numbers. One shared, secure report instead of emailed spreadsheets that are out of date the moment they’re sent.
- Data comes from more than one place. Sales from one system, costs from another, targets in a spreadsheet: Power BI joins them into one model.
- You rebuild the same report every month. Set it up once and it refreshes itself, on a schedule if you like.
- Your files are getting too big or too slow. Power BI handles millions of rows comfortably.
- You want people to explore, not just read. Click a region, a month or a product and every chart filters instantly.
A quick comparison
| Excel | Power BI | |
|---|---|---|
| Best for | Building, modelling, data entry | Reporting, dashboards, sharing |
| Data size | Comfortable to tens of thousands of rows | Millions of rows |
| Sharing | Email or shared files | Secure online reports and apps |
| Refresh | Manual (or Power Query refresh) | Automatic and scheduled |
| Interactivity | Slicers and pivots | Click-to-filter across every visual |
| Learning curve | Most people already know it | Some training needed to build, very little to use |
You don’t have to choose
The two work best together. Power Query, the tool that cleans and combines data, is the same in Excel and Power BI, so work you’ve already done often moves straight across. Many of my clients keep budgets and input sheets in Excel and use Power BI to report on them, with Excel feeding the data and Power BI telling the story.
Five questions to decide
- How many people need to see this report?
- Does the data come from more than one source?
- How many hours a month does it take to update?
- Do people need to drill into the detail themselves?
- Does anyone need to type data into it?
If you answered “more than two”, “yes”, “more than a couple”, “yes” and “no”, Power BI is probably worth it. If it’s mostly the other way round, a well-built Excel workbook will serve you better and cost less.
What about cost?
Power BI Desktop, the tool for building reports, is free. To share reports online, each person who views them needs a Power BI Pro licence (or your organisation needs a capacity licence), so check Microsoft’s current pricing for your team size. For most small businesses the licence cost is small compared with the hours saved on manual reporting.
See it in action
I’ve built three demo dashboards for a fictional UK distributor: sales performance, a one-page month-end management pack and operations KPIs. You can see them on my Power BI page.
Not sure which route is right for you? Book a free 15-minute call and I’ll tell you honestly. And if Excel is the answer, my ready-made Excel templates start from £7.